|
Introduction Companies are always trying to find better ways to understand their customer base in order to acquire new customers more effectively. Instead of targeting random people for their marketing campaigns, it is much more effective to focus on people that are more prone to have a positive response to it. This project is an example of such a situation! In this project, I analyzed demographics data for customers of a mail-order sales company (provided by Arvato Financial Services) in Germany, comparing it against demographics information for the general population. This involves customer segmentation and behaviour prediction. In this project, I had two main goals: 1) Identify and compare clusters of people from the general population that match the customer base using Unsupervised Learning. For this goal, I used two data files called azdias and customers. The former contained demographic data of several people from the general population of Germany, while the latter contained similar data, but only of Arvato Financial Services customers. 2) Predict who has a high probability of becoming a customer using Supervised Machine Learning. For this goal, I used other two datasets that were also similar to the previous ones (train and test). These datasets contained data of people that were subjected to a marketing campaign. There was an additional variable showing whether or nor the person became a customer after the campaign in one of these datasets, that served as the response variable for training the ML algorithms. The Jupyter Notebook containing all the analyses and other information can be found on my Github. Data description 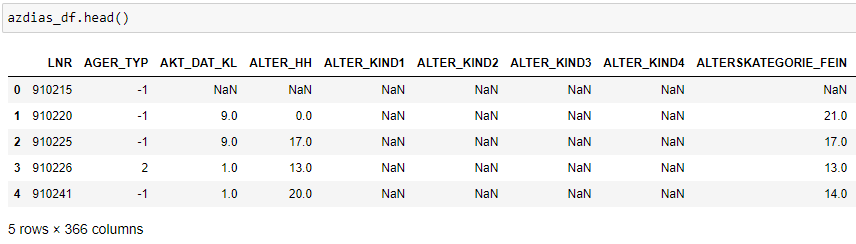 All datasets used in this project share the same set of variables (although some of them have other few additional columns). To be more specific, they have at least 366 variables related to different demographic information and most of them were numeric (only 6 were not). The range of the numeric variables (their maximum minus their minimum) was mostly small (see below, few columns were left out of this plot). While the azdias dataset (general population) had 891221 rows, the customers datset (customers) had 191652 rows, each of them representing an individual. The train and test datasets used for supervised ML had 42962 and 42833 rows, respectively. 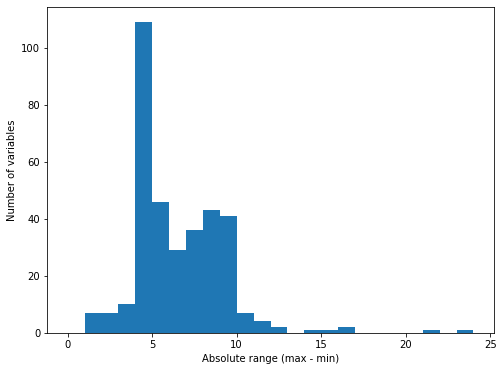 Data cleaning Several steps were necessary to clean the data: There were several data points that were numeric (e.g. -1 or 0) but were in fact unknown values. Thus, I first had to identify these values and label them as null. Below are histograms on the proportion of null values for rows and columns of the azdias and customers datasets after correcting this issue. Second, I removed rows that had too many null values, using a threshold of 15%. If it was above this limit, I deleted them from the dataset. Third, I did a similar thing with columns. I removed columns that had more than 75% of null values. Lastly, I imputed values for the remaining null values in the dataset, using the mode of each column. I used the same process with all datasets, reducing the number of columns to 354. The resulting number of rows were 737288 (azdias), 134246 (customers) and 33837 (training). The only exception was the test dataset, for which I did not exclude rows above a certain null threshold value because I wanted to maintain all the rows (to predict response to marketing campaign for all of them). 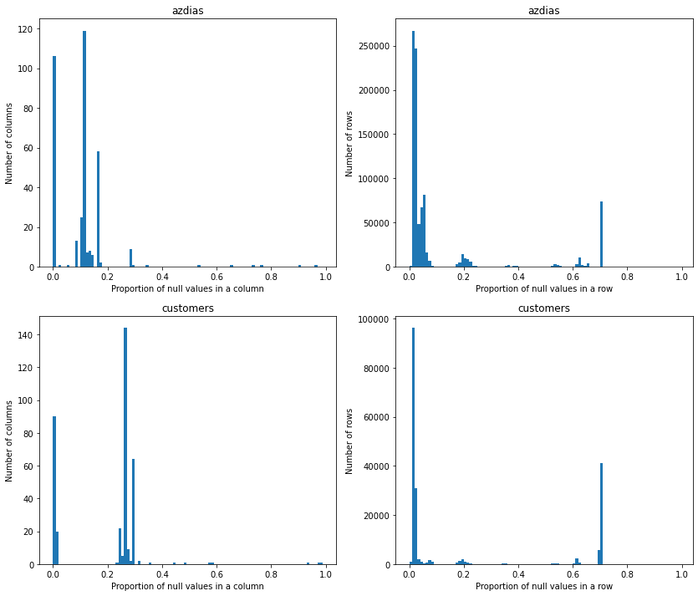 Reduction in data dimensions After cleaning the data, each dataset still contained 354 columns. Thus, before applying clustering algorithms, it was important to reduce the dimensions of data using Principal Component Analysis (PCA). I settled for 210 columns after seeing these curves (below) which still explained 93% of the original data. 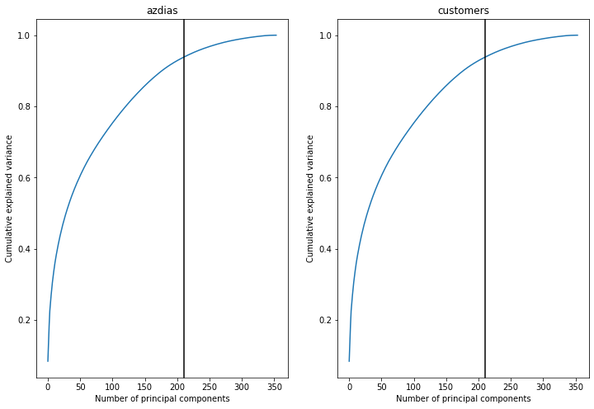 Unsupervised learning: clustering I used KMeas algorithm to do the clustering of the data. To settle on how many clusters there should be, I used the elbow and gap methods (below), choosing 11 in the end. 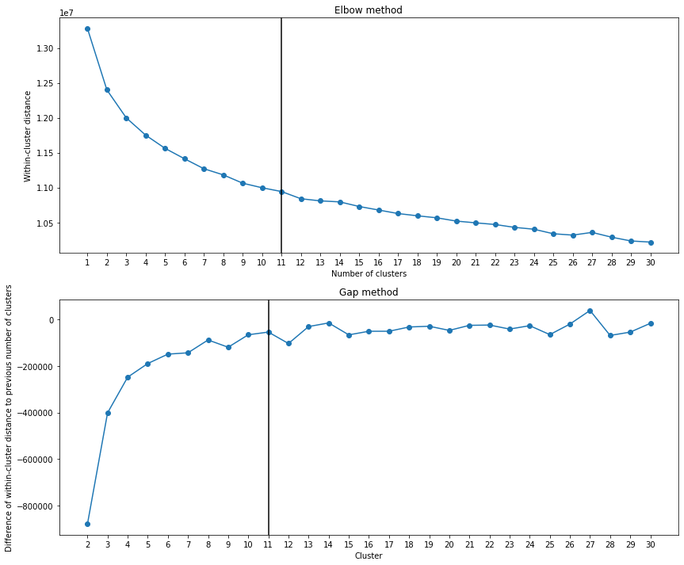 From this, I compared clusters between the general population and customers. There greatest customer overrepresentation occurred for cluster 1 and the greatest customer underrepresentation occured in cluster 4. 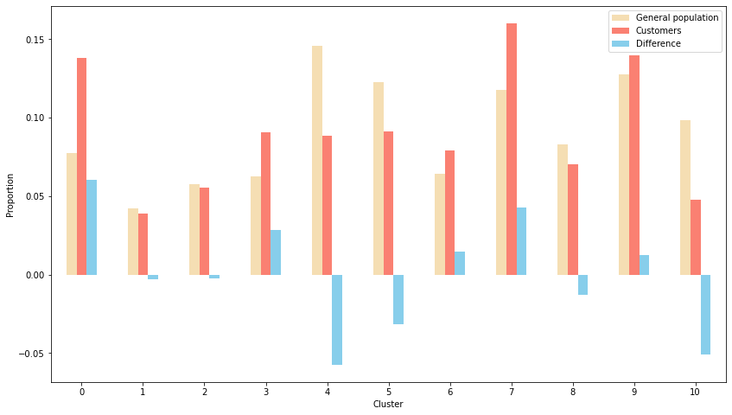 Supervised learning: predictions After cleaning the training dataset used in this part the same way I did for the first two datasets (used for the clustering part), I saw that the response variable (whether the person became a customer after the campaign) was very imbalanced (see below). Therefore, I used ROC/AUC to evaluate classifiers, as it is less problematic for such situations than many other evaluation metrics (e.g. precision, f1-score).  First, I fitted the data to three different classifiers with their default parameters (logistic regression, random forest classifier, and gradient boosting classifier). I used GridSearchCV with stratified cross-validation (5-fold), meaning that for each fit I had five ROC/AUC scores. The algorithm that had the best perfomance with default paramaters was gradient boosting classifier. 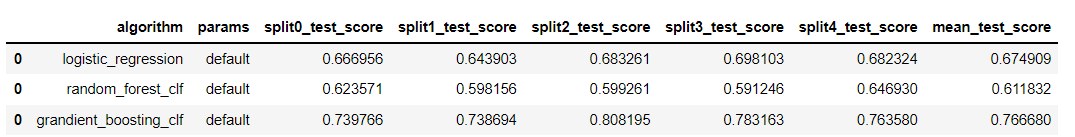 I then tried to fine tune the fit a little more with the gradient booster classifier. However, I only managed to evaluate a few parameters settings because of the huge processing power involved. I changed two parameters: min_samples_leaf (1 and 2) and n_estimators (100 and 150). The best parameter setting was the one with min_sample_leaf as 2 and n_estimators as 150. Yet, note that the best ROC/AUC score for the best model (0.768) is only marginally greater than with the default parameters (0.766). 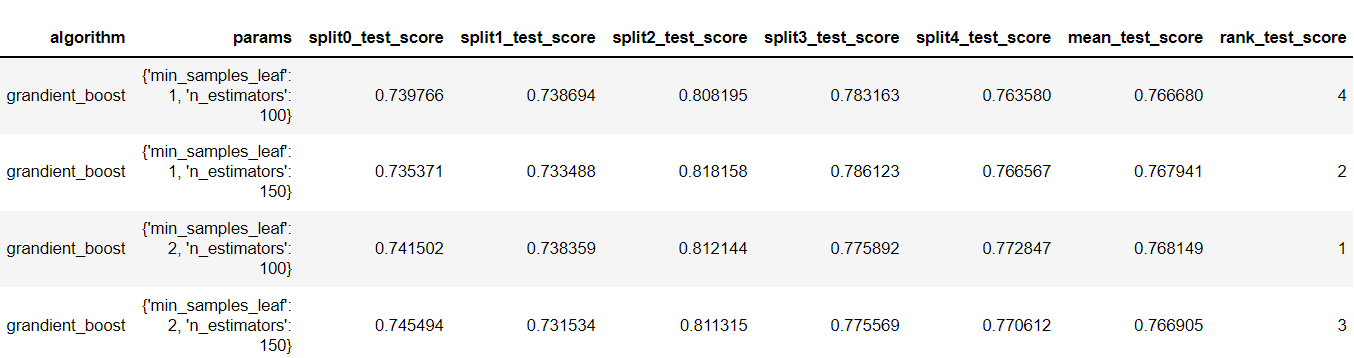 Conclusion
This project was a great example of how data can drive solutions to companies, giving them more precise information for business decisions. Personally, this was an outstanding opportunity to understand different elements of the machine learning process, from challenges with data cleaning, evaluation metrics and algorithms. Of course, further procedures could be taken to improve the predictions made, such as more specific data cleaning, use of other algorithms and better parameter tuning. However, there is always a trade off between the quality of a project and the time spent in it, so it is a matter of finding the balance between the two.
0 Comments
Leave a Reply. |
